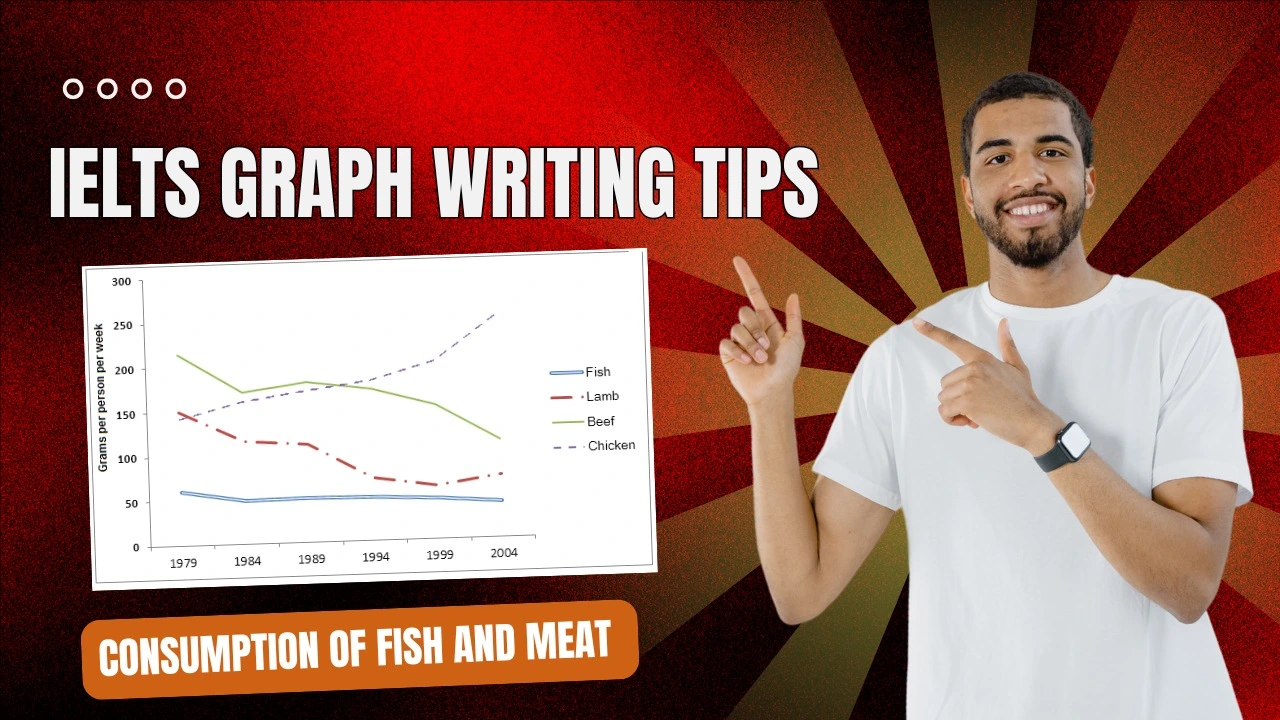
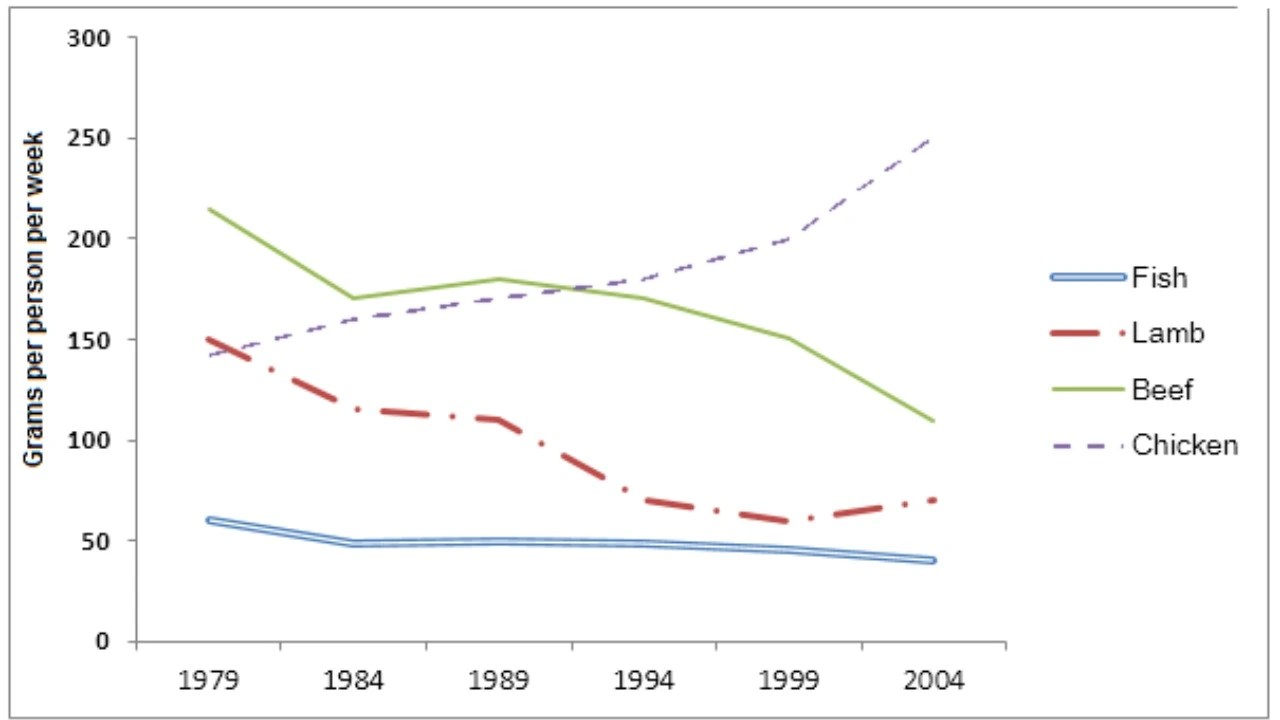
Welcome to another IELTS lesson from your trusted (YLIC) guide on this journey. In this Writing task, we have a line graph, which shows three types of fish and meat consumption: chicken, beef, and lamb over the past 25 years in one of the European countries.
Confused about how to approach such a Writing task? Or what to do if you have many numbers around you? IELTS Writing Task 1 often requests such an assignment. With my 13 years of experience in IELTS coaching, here I am to break down graph analysis for you so that everything becomes as clear as glass for you. Let’s step by step.
You should spend about 20 minutes on this task.
Summarize the detailing, identifying and reporting the important features, and noting any comparisons made.
Use at least 150 words.
Consumption of Fish and Meat IELTS WRITING SAMPLE 1:
The line graph illustrates the weekly consumption per person of four kinds of food in a European country from 1979 to 2004: chicken, beef, lamb, and fish. In grams, it has been measured.
As a result, consumption of chicken significantly increased, while beef and lamb declined significantly in extreme terms over the period covered by the study. Consumption of fish leveled off, showing a small decline.
In 1979 beef was the biggest meat consumed at around 220 grams per person per week chicken at 150 grams and lamb at about 150 grams. Fish was the lowest consumed, at roughly 60 grams per person per week. Chicken consumption steadily increased year after year then surpassed lamb and beef in the mid-1980s and reached about 250 grams by the end of 2004.
On the other hand, beef consumption varied and then sharply declined to only around 100 grams in 2004. Lamb consumption decreased and fell to less than 60 grams by the end of the period. The consumption of fish, the lowest of all, fell a little but, once again remained relatively stable at a little more than 50 grams per person per week.
In brief, chicken became the most popular meat in consumption but substantially increased, whereas beef, lamb, and fish decreased or remained unchanged.
Consumption of Fish and Meat IELTS WRITING SAMPLE 2:
This line graph tracks the trend in per capita consumption of fish, chicken, beef, and lamb over the period from 1979 to 2004 in an average European country. Chicken seems to have registered relatively large increases; beef and lamb more modest, fairly large declines; while consumption of fish remained relatively stable but with a downward trend.
Beef is the preferred meat, averaging around 220 grams per person per week, whilst chicken and lamb are about 150 grams. Fish is relatively low consumption averaging about 60 grams. Chicken consumption was steady, surpassing that of lamb in the early years of the 1980s and that of beef around 1989, eventually attaining a level of about 250 grams by 2004.
In contrast, beef consumption dropped substantially, finishing at roughly 100 grams per person per week. Lamb followed a similar downward trend, ending at about 60 grams by 2004. Fish consumption saw only a slight decrease, maintaining a relatively low level throughout the years.
Overall, chicken consumption rose dramatically, making it the most popular choice by 2004, while beef and lamb saw declines, and fish consumption remained comparatively low and steady.
Consumption of Fish and Meat IELTS WRITING SAMPLE 3:
The above line graph indicates trends in European weekly consumption per head of chicken, beef, lamb, and fish between 1979 and 2004. Chicken consumption leaped up dramatically throughout the entire period of consideration, while beef and lamb declined. Fish consumption was low and stable.
Beef was the most significantly consumed meat at the start of the period at about 220 g per person per week, followed by lamb and chicken, at about 150 g. Fish consumption was low from the start, at about 60 g, and little changed over time. In contrast, chicken consumption rose gradually through the period, came to exceed both lamb and beef consumers in the 1980s, and stood at about 250 grams in 2004 – by which time it was the most consumed meat at the end of the period.
Both lamb and beef inexorably fell after the early 1980s, with beef down to around 100 grams, and lamb to 60 grams, by 2004. In contrast, fish consumption, the lowest throughout, fell only marginally, ending at about 50 grams.
In conclusion, chicken became the preferred choice over time, while beef and lamb fell out of favor, and fish consumption remained consistently low.
Pro Tips for Writing About Consumption of Fish and Meat IELTS Writing Task 1
1. Start with an Overview Statement
Begin with a short paragraph that summarizes the overall trends. For example, mention which types of meat saw an increase or decrease over time, and which remained relatively stable. This helps the examiner see that you understand the main trends right away.
2. Group Similar Trends Together
Instead of describing each line separately, group items with similar trends. For instance, both beef and lamb saw a decline, so you can describe them together. Chicken, which increased, can be discussed separately, and fish, which was stable, can be described briefly. Grouping like this makes your response more coherent.
3. Use Comparisons to Show Relationships
IELTS examiners love to see comparisons! Mention how chicken overtakes beef and lamb by the mid-1980s, or how fish remains consistently lower than all other meats. Making these comparisons highlights your analytical skills.
4. Use Accurate Vocabulary for Trends
Some great vocabulary to use here includes:
Increase: rose, grew, climbed, went up, showed an upward trend
a) Decrease: declined, dropped, fell, decreased, showed a downward trend
b) Stability: remained steady, stayed the same, was stable
c) Fluctuation: use this word if there are ups and downs without a clear trend, though in this graph the trends are mostly clear.
5. Add Data to Illustrate Your Vignette
Use real numbers to back this up. Instead of saying “Beef consumption declined,” say “Beef consumption fell from about 220 grams to about 100 grams per person per week by 2004.” That way you can demonstrate that you can actually read the data.
6. Conclude with a Summary
After discussing the main details, wrap up with a short summary sentence. Restate the biggest trends, like how chicken became the most popular meat by 2004, or how fish consumption remained low and steady throughout.
7. Avoid Repetition
Avoid using the same words repeatedly. Instead of saying “increase” several times, try “rose” or “climbed.” Using a range of vocabulary is important for a high band score in IELTS.
Remember, practice makes perfect! Try writing about similar graphs, and apply these strategies to get comfortable with them. With consistent practice, you’ll find this task gets easier—and you’ll be well on your way to achieving that high IELTS score. Good luck, and keep going strong!

